Randy C. Benning, CFP Presents:
THE WEEK ON WALL STREET
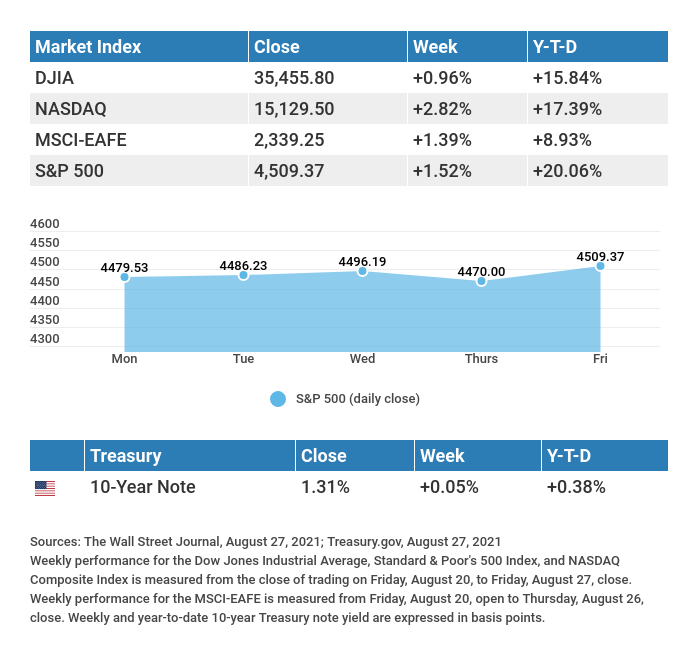
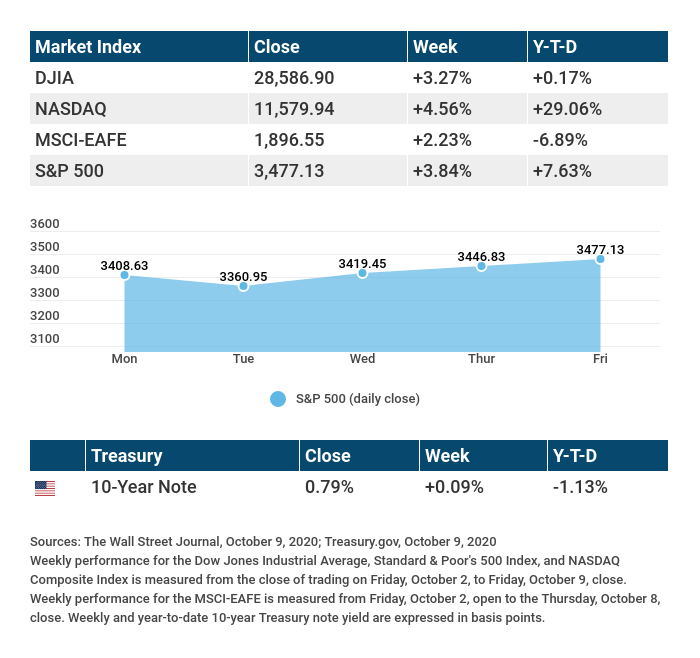
A strong opening to the third-quarter earnings season sparked a late week, broad-based rally that helped stocks finish the week with solid gains.
The Dow Jones Industrial Average rose 1.58%, while the Standard & Poor’s 500 added 1.82%. The Nasdaq Composite index led, gaining 2.18% for the week. The MSCI EAFE index, which tracks developed overseas stock markets, was up 1.37%.1,2,3
INVESTOR OPTIMISM RETURNS
After beginning the week on a lackluster note, stocks turned higher on Wednesday as companies kicked off a new earnings season and details about the Fed’s taper plans emerged. Investor enthusiasm shifted into high gear the following day on positive economic data and earnings reports that exceeded investor expectations. Buying continued through Friday on fresh earnings surprises and a better-than-expected retail sales report.
The economic data allayed some concerns about inflationary pressures and economic deceleration, while early earnings results provided hope that companies had weathered the surge in summer Covid infections. Nevertheless, worries about how supply-chain disruption and higher prices may impact corporate earnings guidance haven’t gone away.
LET THE TAPERING BEGIN
Minutes from September’s Federal Open Market Committee released last week provided detail around the Fed’s plans to taper its $120 billion monthly bond purchase program. The Fed expects to reduce its purchases by $15 billion each month, beginning in mid-November/December and ending in June 2022.4
This tapering schedule is somewhat faster than what investors were anticipating, reflecting the Fed’s concern that inflation has been somewhat higher and more persistent than it had anticipated, with continuing supply-chain bottlenecks raising that risk level. Fed Chair Powell’s commitment to transparency and advanced signaling of policy changes appeared to have worked, as markets greeted the news calmly. In fact, stocks rallied strongly the following day as yields moved lower.
T I P O F T H E W E E K
Retiring in the near future? A monthly retirement budget is a good idea – and so is a current budget that establishes a schedule for paying down debts and reducing costs before you enter into a new phase of life.
THE WEEK AHEAD: KEY ECONOMIC DATA
Monday: Industrial Production.
Tuesday: Housing Starts.
Thursday: Jobless Claims. Existing Home Sales. Index of Leading Economic Indicators.
Friday: PMI (Purchasing Managers’ Index) Composite Flash.
Source: Econoday, October 15, 2021
The Econoday economic calendar lists upcoming U.S. economic data releases (including key economic indicators), Federal Reserve policy meetings, and speaking engagements of Federal Reserve officials. The content is developed from sources believed to be providing accurate information. The forecasts or forward-looking statements are based on assumptions and may not materialize. The forecasts also are subject to revision.
THE WEEK AHEAD: COMPANIES REPORTING EARNINGS
Tuesday: Netflix, Inc. (NFLX), Johnson & Johnson (JNJ), Procter & Gamble (PG), Kansas City Southern (KSU).
Wednesday: Tesla, Inc. (TSLA), International Business Machines (IBM), Verizon Communications (VZ), Abbott Laboratories (ABT), United Airlines (UAL), CSX Corporation (CSX).
Thursday: AT&T, Inc. (T), Intel Corporation (INTC), Snap, Inc. (SNAP), PPG Industries, Inc. (PPG), Southwest Airlines (LUV), American Airlines Group, Inc. (AAL), Union Pacific Corporation (UNP), Chipotle Mexican Grill, Inc. (CMG), Danaher Corporation (DHR), Dow, Inc. (DOW).
Friday: American Express Company (AXP), HCA Healthcare, Inc. (HCA), Schlumberger Limited (SLB).
Source: Zacks, October 15, 2021
Companies mentioned are for informational purposes only. It should not be considered a solicitation for the purchase or sale of the securities. Investing involves risks, and investment decisions should be based on your own goals, time horizon, and tolerance for risk. The return and principal value of investments will fluctuate as market conditions change. When sold, investments may be worth more or less than their original cost. Companies may reschedule when they report earnings without notice.

Randy C. Benning, CFP®, President, License # 0816882, Benning Financial Group, LLC. Investment Advisory Services offered through Benning Financial Group, LLC, A Registered Investment Advisor, Benning Financial Group, LLC
Investing involves risks, and investment decisions should be based on your own goals, time horizon, and tolerance for risk. The return and principal value of investments will fluctuate as market conditions change. When sold, investments may be worth more or less than their original cost.
The forecasts or forward-looking statements are based on assumptions, may not materialize, and are subject to revision without notice.
The market indexes discussed are unmanaged, and generally, considered representative of their respective markets. Index performance is not indicative of the past performance of a particular investment. Indexes do not incur management fees, costs, and expenses. Individuals cannot directly invest in unmanaged indexes. Past performance does not guarantee future results.
The Dow Jones Industrial Average is an unmanaged index that is generally considered representative of large-capitalization companies on the U.S. stock market. Nasdaq Composite is an index of the common stocks and similar securities listed on the NASDAQ stock market and is considered a broad indicator of the performance of technology and growth companies. The MSCI EAFE Index was created by Morgan Stanley Capital International (MSCI) and serves as a benchmark of the performance of major international equity markets, as represented by 21 major MSCI indexes from Europe, Australia, and Southeast Asia. The S&P 500 Composite Index is an unmanaged group of securities that are considered to be representative of the stock market in general.
U.S. Treasury Notes are guaranteed by the federal government as to the timely payment of principal and interest. However, if you sell a Treasury Note prior to maturity, it may be worth more or less than the original price paid. Fixed income investments are subject to various risks including changes in interest rates, credit quality, inflation risk, market valuations, prepayments, corporate events, tax ramifications and other factors.
International investments carry additional risks, which include differences in financial reporting standards, currency exchange rates, political risks unique to a specific country, foreign taxes and regulations, and the potential for illiquid markets. These factors may result in greater share price volatility.
Please consult your financial professional for additional information.
This content is developed from sources believed to be providing accurate information. The information in this material is not intended as tax or legal advice. Please consult legal or tax professionals for specific information regarding your individual situation. This material was developed and produced by FMG Suite to provide information on a topic that may be of interest. FMG is not affiliated with the named representative, financial professional, Registered Investment Advisor, Broker-Dealer, nor state- or SEC-registered investment advisory firm. The opinions expressed and material provided are for general information, and they should not be considered a solicitation for the purchase or sale of any security.
Copyright 2021 FMG Suite.
CITATIONS:
1. The Wall Street Journal, October 15, 2021
2. The Wall Street Journal, October 15, 2021
3. The Wall Street Journal, October 15, 2021
4. The Wall Street Journal, October 13, 2021